
How to Use Moving Averages in Trading
What is moving average?
&
Pros and cons of using moving averages in stock trading
What is moving average
Price trend of a given stock is never smooth which makes it hard to get an opinion about the approximate future direction of the price trend. And moving averages are mainly used to cope with this challenge by helping smooth out the price data. It is a commonly used technical indicator in technical analysis. Traders/Investors can use either short term or long term moving averages depending on their trading/investing interests. With the help of moving averages, negative impacts of short-term fluctuations on the price of a stock are mitigated.
When calculating the moving average, the average is taken over a specific period of time, i.e. 5, 20, 50 or 200 days. And averages do not have to be taken on daily prices, it is also common to use weekly, monthly or minute based averages as well if such forms suit better for the type of trading strategy that is executed.
It is not possible to be 100% accurate in predicting stock prices but you may make some educated guesses and moving averages are one of the common tools that are used in technical analysis when estimating the potential future direction of a stock’s price. We will look into 2 ways of using moving averages in this study.
1) Golden Cross & Death Cross
When a relatively short-term moving average crosses above a long-term moving average, it is called Golden Cross and perceived as the confirmation of an uptrend. And when the opposite happens, it is called Death Cross and perceived as a bearish signal.
As an example, traders can buy a certain stock when the 20 days moving average crosses above its 50 days moving average, and can exit from their positions when the 50 days moving average crosses below its 20 days moving average.
Even though this method may work in some cases, it may also trigger quite a number of false positive signals because moving averages are calculated based on past prices and thereby are lagging indicators. Especially in short term trading, a trading method that solely relies on Golden Cross & Death Cross signals may not always be reliable and traders tend to combine these indicators with some other technical indicators as well when making their trading decisions.
The following chart shows this approach in practice. One example is definitely not enough to generalize findings but it is a good example that illustrates why this approach can give signals with a bit of delay which may be an issue especially in short term trading. You can observe the delays in both buy and sell signal points.
2) Stock Price & Moving Average
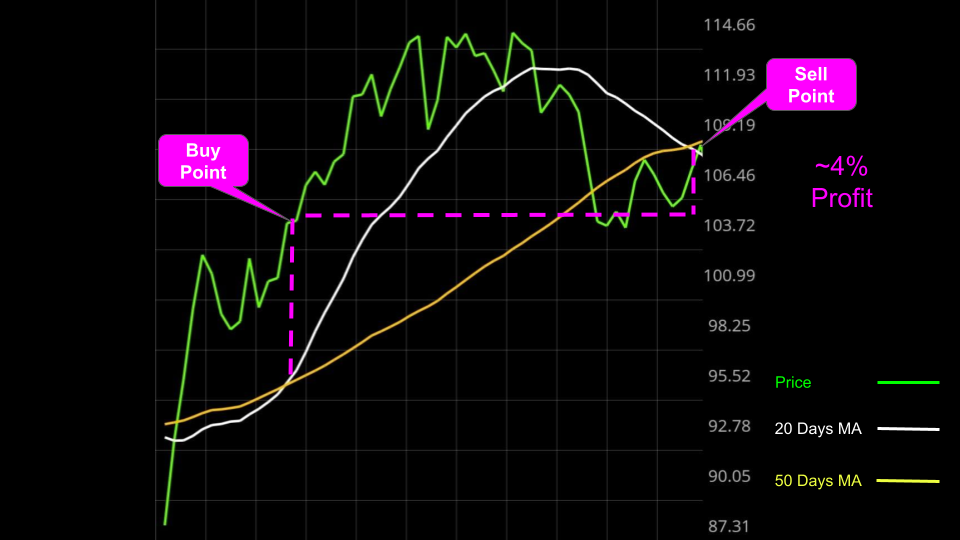
Another way of using moving averages is to compare the direction of stock price and moving average value with each other. If the price of a given stock crosses above its moving average, it is perceived as a bullish signal. And the opposite is considered as a bearish one. Relatively shorter term moving averages (i.e. 20 days) are used for short term trading, and longer term moving averages (i.e. 200 days) are more commonly used for longer term trading. This approach is also prone to generating false positive signals because it still depends on a lagging indicator and should be strengthened by combining with other types of indicators as well to more reliably confirm the trend reversal.
If we look at the same chart from the example above, we can observe that buy and sell signals are triggered with a comparably earlier timing compared to the first approach discussed above; and this happens to be an advantage in this particular example. However, this may not always bring an advantage because this second approach can, for example, trigger an unnecessary (or too early) sell signal while the uptrend is not yet over.

Final Words
Both approaches discussed above have their own pros and cons. The second approach discussed above will likely be triggering buy & sell signals a bit quicker than the first one because it relies on the 20 days moving average while the first approach relies on both 20 and 50 days moving averages and since 50 days is a lot longer than 20 days it will lead to triggering signals with a bit of delay (compared to the other approach). When it comes to which approach can be more profitable when used in trading, the answer will likely be “It depends” because both approaches may perform differently based on market conditions (i.e. in a bear market or bull market) and also which periods (20, 50, 200 or another value) are selected when calculating moving averages.
At the end of the day, since moving averages are lagging indicators, they should anyhow not be used as the only indicator when developing trading strategies. But they can be used in combination with other types of technical indicators to confirm the occurrence of potential trend reversals. You can select the one that makes more sense to your trading strategy but it is a more common practice to look at different technical indicators when developing trading strategies rather than using only one single indicator.


