Navigating Stock Markets During High Inflation: Short-Term Trading Strategies​

Navigating Stock Markets During High Inflation: Short-Term Trading Strategies

In the world of finance, the relationship between inflation and the stock market is a complex dance, often triggering a series of intricate responses and outcomes. In recent times, the prospect of high inflation has sparked concerns among investors and traders alike. This article aims to delve into the effect of high inflation on stock markets and offer insights into developing short-term trading strategies to navigate these challenging waters.

Understanding the Inflation-Stock Market Connection

Inflation refers to the sustained increase in the general price level of goods and services in an economy. While moderate inflation is considered a normal economic phenomenon, high inflation can have far-reaching implications, including its impact on the stock market.

1. Equity Valuations: High inflation can erode the purchasing power of consumers, potentially leading to reduced spending. This, in turn, might impact corporate earnings, thereby affecting stock valuations.

2. Interest Rates: Central banks often respond to inflation by raising interest rates to curb spending. Higher interest rates can make borrowing more expensive for businesses and consumers, potentially slowing down economic activity and affecting stock performance.

3. Investor Sentiment: The uncertainty brought about by inflation can lead to heightened market volatility. Investors may become more cautious, leading to rapid shifts in sentiment and trading patterns.

4. Sector Performance: Different sectors respond differently to inflation. While sectors like energy and commodities might thrive, others like technology and consumer discretionary could face challenges due to higher input costs and reduced consumer spending.

Developing Short-Term Trading Strategies

In times of high inflation, short-term trading strategies need to adapt to the changing market dynamics. Here are some strategies to consider:

1. Sector Rotation: Given the varying impacts of inflation on different sectors, consider rotating your investments based on the prevailing economic conditions. Defensive sectors like utilities and healthcare might perform relatively better during inflationary periods.

2. Inflation-Resistant Stocks: Identify companies with strong pricing power and the ability to pass on increased costs to consumers. These companies are better positioned to weather the inflation storm.

3. Dividend Stocks: Dividend-paying stocks could offer stability and a source of income during volatile times. Dividends can act as a hedge against the eroding effects of inflation on purchasing power.

4. Tactical Hedging: Consider using options and other derivatives to hedge your portfolio against potential downturns. However, options trading requires a good understanding of the market and comes with risks.

5. Stay Informed: Keep a close eye on economic indicators, central bank policies, and inflation reports. Timely information can help you adjust your strategies as the situation evolves.

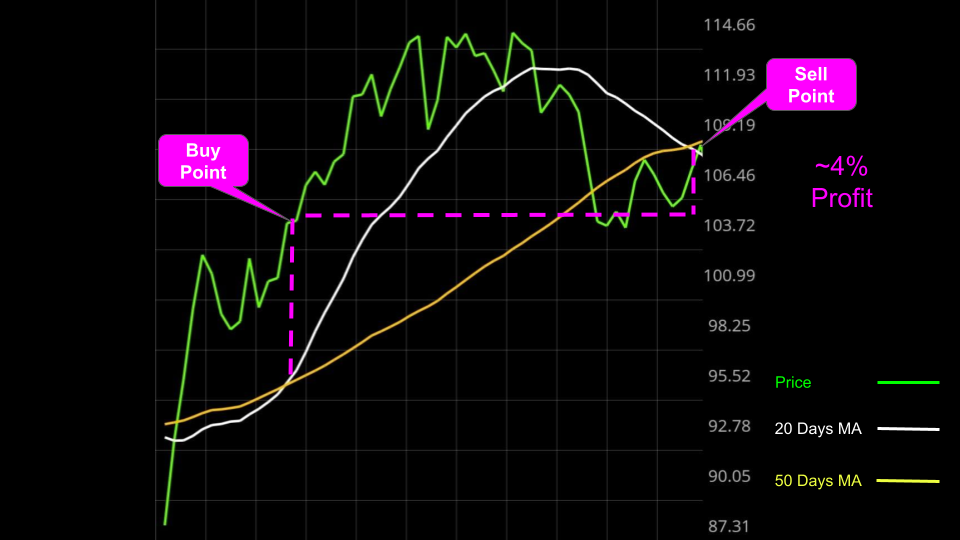
6. Technical Analysis: Short-term traders often rely on technical analysis to identify trends and patterns. Volatile markets driven by inflation can create opportunities for short-term gains based on these analyses.

7. Flexible Approach: Stay open to adjusting your strategies based on market developments. High inflation can lead to rapid changes, so flexibility is key.

Conclusion

High inflation presents a unique set of challenges and opportunities for traders in the stock market. While the relationship between inflation and stock performance is intricate, understanding the potential impacts and adapting strategies accordingly can lead to better outcomes. Remember, short-term trading requires a deep understanding of market dynamics, risk management, and continuous learning. As with any trading strategy, it’s crucial to be well-informed, remain patient, and exercise caution while navigating the complexities of high inflation environments.

Share Predictions mobile app provides AI powered stock price change predictions in the short term, trend trading portfolio signals, and premium technical analysis tools, with focus on stock markets in USA. Share Predictions is available in both Apple App Store and Google Play Store.

Mastering Risk Management: Safeguarding Your Stock Market Investments

Mastering Risk Management: Safeguarding Your Stock Market Investments

Introduction:

Investing in the stock market offers exciting opportunities for wealth creation. However, it’s important to understand that along with the potential for gains, there are inherent risks. Successful investors recognize the significance of risk management in preserving capital and achieving long-term financial goals. In this blog post, we will explore key principles and strategies for effective risk management in stock market investing.

  1. Diversification: Spreading Your Risk

    Diversification is a fundamental risk management technique that involves allocating investments across different asset classes, industries, and geographic regions. By diversifying your portfolio, you reduce the impact of a single stock’s performance on your overall investment. This strategy helps protect against the adverse effects of company-specific events or industry downturns.

  2. Setting Stop-Loss Orders: Controlling Losses

    Stop-loss orders are an essential tool for limiting potential losses. By setting a predetermined price at which you’re willing to sell a stock, you protect yourself from excessive downside risk. Stop-loss orders automatically trigger a sell order when the stock price reaches the specified level, preventing further losses in case of significant market declines or unexpected negative news.

  3. Position Sizing: Managing Exposure

    Managing the size of your positions is crucial for risk control. Avoid allocating an excessively large portion of your portfolio to a single stock or sector. By limiting the percentage of your total investment to each position, you reduce the impact of any individual stock’s performance on your overall portfolio. This approach helps prevent significant losses due to the underperformance of a particular stock or sector.

  4. Research and Due Diligence: Informed Decision-Making

    Thorough research and due diligence are vital components of risk management. Before investing in a stock, carefully analyze the company’s financial statements, industry trends, competitive landscape, and growth prospects. Understand the risks associated with the investment and assess whether they align with your risk tolerance and investment objectives.

  5. Regular Portfolio Review: Adapting to Market Conditions

    Regularly reviewing and rebalancing your portfolio is an important risk management practice. As market conditions change, certain stocks or sectors may become overvalued or underperforming. Periodically reassess your investments and make adjustments as needed to maintain a well-balanced portfolio. Rebalancing ensures that your asset allocation remains aligned with your risk tolerance and investment goals.

  6. Emotion Management: Avoiding Impulsive Decisions

    Emotions can cloud judgment and lead to impulsive investment decisions. Fear and greed can drive investors to make irrational choices during market volatility. Maintaining discipline and sticking to your predetermined investment strategy is crucial for effective risk management. Avoid making emotional decisions based on short-term market fluctuations, and focus on your long-term investment objectives.

Conclusion:

Risk management plays a pivotal role in stock market investing. By diversifying your portfolio, setting stop-loss orders, managing position sizes, conducting thorough research, regularly reviewing your investments, and controlling emotions, you can safeguard your capital and navigate the inherent risks of the stock market. Remember, successful investing is a long-term endeavor, and incorporating robust risk management practices is a vital step towards achieving your financial goals.

As always, consult with a qualified financial advisor or professional before making any investment decisions.

Note: This blog post is for informational purposes only and should not be construed as financial advice.

Share Predictions mobile app provides AI powered stock price change predictions in the short term, trend trading portfolio signals, and premium technical analysis tools, with focus on stock markets in USA. Share Predictions is available in both Apple App Store and Google Play Store.

Using Machine Learning for Risk Management and Capital Allocation in Stock Trading

Using Machine Learning for Risk Management and Capital Allocation in Stock Trading

Introduction:


The stock market is a complex and dynamic system that can be difficult to navigate. To be successful, traders need to not only identify profitable opportunities but also manage risk and allocate capital effectively. In recent years, machine learning has emerged as a powerful tool for traders to enhance their risk management and capital allocation strategies. In this blog post, we will explore some of the ways that machine learning can be used to improve risk management and capital allocation in stock trading.

Section 1: Understanding Risk Management


Risk management is the process of identifying, assessing, and controlling potential risks that may impact a trader’s portfolio. Some common risks in stock trading include market risk, liquidity risk, credit risk, and operational risk. One way that machine learning can be used in risk management is by building models to predict the likelihood of certain risks occurring. For example, a machine learning model can be used to predict the probability of a market downturn or a sudden increase in volatility. This information can then be used to adjust a trader’s portfolio to mitigate the potential impact of these risks.

Section 2: Machine Learning for Capital Allocation


Capital allocation is the process of deciding how much capital to allocate to different investments in a portfolio. The goal of capital allocation is to maximize returns while minimizing risk. Machine learning can be used to improve capital allocation by building models to predict the expected returns and risks associated with different investments. These models can be trained on historical market data and can take into account a wide range of factors, such as macroeconomic indicators, company financials, and market sentiment. By using machine learning to optimize capital allocation, traders can potentially increase returns and reduce risk.

Section 3: Combining Risk Management and Capital Allocation with Machine Learning


While risk management and capital allocation are separate processes, they are closely related. Traders need to balance their risk management strategies with their capital allocation strategies to achieve the best possible results. Machine learning can help traders find this balance by building models that optimize both risk and return. For example, a machine learning model can be used to identify investments that offer high potential returns with low risk. By combining risk management and capital allocation with machine learning, traders can potentially achieve better results than by using these processes separately.

Section 4: Challenges and Considerations


While machine learning has the potential to improve risk management and capital allocation in stock trading, there are also challenges and considerations to keep in mind. One challenge is that machine learning models are not perfect and can be affected by biases and inaccuracies in the data. Traders need to be aware of these limitations and use multiple models and approaches to reduce the impact of any individual model’s shortcomings. Additionally, traders need to ensure that they have access to high-quality data and the computational resources necessary to train and run machine learning models.

Conclusion:


In conclusion, machine learning can be a powerful tool for traders looking to improve their risk management and capital allocation strategies in the stock market. By building models to predict risks and optimize capital allocation, traders can potentially achieve better returns while minimizing risk. However, it is important to keep in mind the challenges and limitations of machine learning and to use multiple approaches to reduce the impact of any individual model’s shortcomings. With careful consideration and implementation, machine learning can help traders navigate the complexities of the stock market and achieve their financial goals.

Share Predictions mobile app provides AI powered stock price change predictions in the short term, trend trading portfolio signals, and premium technical analysis tools, with focus on stock markets in USA. Share Predictions is available in both Apple App Store and Google Play Store.

5 Sophisticated Trading Techniques for High Volatility in the Stock Market

5 Sophisticated Trading Techniques for High Volatility in the Stock Market

Navigating High Volatility in the Stock Market
&
Profiting from High Volatility

In this blog post, we will discuss some trading techniques that can be used in the stock market when volatility is high. High volatility means that the market is experiencing larger price swings than usual, making it more challenging to predict market movements. Here are some techniques that traders use to navigate high volatility, along with their pros and cons:

  1. Breakout trading: Breakout trading is a trading strategy that aims to take advantage of significant price movements after a breakout from a trading range. The idea behind this technique is to identify support and resistance levels and wait for a breakout above or below those levels. If the price breaks above the resistance level, it may indicate a bullish trend, and traders may buy the stock. Similarly, if the price breaks below the support level, it may indicate a bearish trend, and traders may sell the stock.

Pros: Breakout trading is an easy-to-understand strategy that can help traders take advantage of significant price movements. It can be applied to any stock or market.

Cons: Breakout trading can be risky, as false breakouts can occur, resulting in significant losses.

  1. Volatility trading: Volatility trading is a trading technique that aims to take advantage of the volatility of the stock market. The idea behind this technique is to buy or sell options contracts that are based on the expected volatility of the stock. If the expected volatility of the stock is high, the price of the options contracts will be higher, and traders may sell them. Similarly, if the expected volatility of the stock is low, the price of the options contracts will be lower, and traders may buy them.

Pros: Volatility trading can help traders take advantage of changes in the stock market’s volatility. It can provide a good hedge against market risk.

Cons: Volatility trading can be complex, and traders need to have a good understanding of options trading.

  1. Trend-following trading: Trend-following trading is a trading technique that aims to take advantage of the stock market’s trends. The idea behind this technique is to identify the direction of the trend and then trade in the direction of the trend. If the stock is in an uptrend, traders may buy the stock, and if the stock is in a downtrend, traders may sell the stock.

Pros: Trend-following trading can help traders take advantage of the stock market’s trends, which can provide a high probability of success.

Cons: Trend-following trading can be challenging, as traders need to have a good understanding of technical analysis and market trends.

  1. Mean-reversion trading: Mean-reversion trading is a trading technique that aims to take advantage of the stock market’s tendency to revert to its mean. The idea behind this technique is to identify when a stock’s price is deviating from its mean and then buy or sell the stock with the expectation that it will revert to its mean.

Pros: Mean-reversion trading can provide a high probability of success, as the stock is likely to revert to its mean.

Cons: Mean-reversion trading can be challenging, as traders need to have a good understanding of statistical analysis and market trends.

  1. Position trading: Position trading is a trading technique that aims to take advantage of long-term trends in the stock market. The idea behind this technique is to hold a position in a stock for an extended period, such as several months or even years. Traders may enter a long position in a stock that they believe will increase in value or a short position in a stock that they believe will decrease in value.

Pros: Position trading can provide significant profits over the long term and can help traders take advantage of the stock market’s trends.

Cons: Position trading can be risky, as significant losses can occur if the trader is on the wrong side of the trend.

In conclusion, high volatility in the stock market can be challenging for traders, but by using sophisticated trading techniques such as breakout trading, volatility trading, trend-following trading, mean-reversion trading, and position trading, traders can navigate the market and capture significant profits. However, it’s important to remember that all trading strategies carry risks, and traders should always use proper risk management techniques to protect themselves from significant losses.

Share Predictions mobile app provides AI powered stock price change predictions in the short term, trend trading portfolio signals, and premium technical analysis tools, with focus on stock markets in USA. Share Predictions is available in both Apple App Store and Google Play Store.

Trading Techniques in Bear Markets

Trading Techniques in Bear Markets

How to navigate in bear markets
&
Trading techniques along with their pros and cons

Trading in bear markets can be a challenging task for investors. During a bear market, stocks tend to decrease in value, making it difficult to generate profits. However, there are several trading techniques that can be used to navigate bear markets and potentially generate returns. In this blog post, we’ll discuss some of the most common techniques, along with their pros and cons.

  1. Short Selling

Short selling is a technique where an investor borrows shares from a broker and sells them, hoping to buy them back at a lower price and return them to the broker. This allows investors to profit from declining stock prices.

Pros:

  • Potential for significant profits during bear markets
  • Opportunity to hedge against market declines

Cons:

  • Unlimited risk – short sellers can lose more than the initial investment if the stock price rises instead of falling
  • High cost of borrowing shares
  • Timing is critical – short sellers must correctly predict when to buy back the shares to realize a profit
  1. Options Trading

Options trading involves buying and selling options contracts, which give the holder the right, but not the obligation, to buy or sell a stock at a specific price. Options can be used to hedge against market declines or to generate profits from declining stock prices.

Pros:

  • Potential for significant profits during bear markets
  • Lower risk compared to short selling
  • Opportunity to hedge against market declines

Cons:

  • Complexity – options trading can be difficult to understand for inexperienced traders
  • Timing is critical – options must be timed correctly to realize a profit
  • Options can expire worthless if market conditions do not meet the trader’s expectations
  1. Dividend Investing

Dividend investing involves buying stocks that pay a steady stream of dividends, regardless of market conditions. During a bear market, the income from dividends can provide a cushion against declining stock prices.

Pros:

  • Potential for steady income during bear markets
  • Lower risk compared to other trading techniques

Cons:

  • Limited potential for capital appreciation during bear markets
  • Dividends can be reduced or eliminated if the company’s financial performance declines
  1. Value Investing

Value investing involves buying stocks that are undervalued relative to their intrinsic value. During a bear market, value investors may be able to find stocks that are temporarily undervalued, providing an opportunity to buy low and sell high.

Pros:

  • Potential for significant capital appreciation during bear markets
  • Opportunity to buy stocks at a discount during market declines

Cons:

  • Timing is critical – value investors must correctly predict when the market will turn and the stock will appreciate in value
  • Value stocks can remain undervalued for extended periods, leading to reduced returns or even losses

In conclusion, each of these trading techniques has its pros and cons, and the best technique for a given investor will depend on their risk tolerance, investment goals, and market outlook. Before making any investment decisions, it’s important to consult with a financial advisor to determine the best strategy for your unique circumstances.

Share Predictions mobile app provides AI powered stock price change predictions in the short term, trend trading portfolio signals, and premium technical analysis tools, with focus on stock markets in USA. Share Predictions is available in both Apple App Store and Google Play Store.

Lagging Indicators

Lagging Indicators

What is lagging indicator in stock trading?
&
Pros & Cons of lagging indicators

Stock trading can be a complex and confusing process, especially for beginners. One of the main challenges for traders is to determine the future performance of a stock based on its past market trends and data. To help traders make informed decisions, technical analysis tools such as lagging indicators have been developed. In this blog post, we will take a comprehensive look at what lagging indicators are, how they work, and their pros and cons in stock trading.

What are Lagging Indicators?

Lagging indicators are a type of technical analysis tool used to help traders determine the future performance of a stock based on past market trends and data. They are called “lagging” because they follow the trend of the market, rather than predicting it. This means that lagging indicators only provide information on the stock’s past performance, which can be used to make predictions about its future performance.

How do Lagging Indicators Work?

Lagging indicators work by analyzing past market data and trends to determine the overall direction of the market. Some of the most common lagging indicators include moving averages, Bollinger Bands, and trend lines. These indicators use mathematical algorithms to determine the average price of a stock over a certain period of time, and then plot this data on a chart to create a visual representation of the stock’s performance. By analyzing this data, traders can determine the overall trend of the stock and make predictions about its future performance.

Pros of Using Lagging Indicators in Stock Trading

  1. Clear Picture of Past Market Trends and Data: One of the biggest advantages of using lagging indicators is that they provide a clear picture of past market trends and data, allowing traders to make informed decisions. This information can be used to determine the strength of a trend, which can help traders to determine the best time to enter or exit a trade.

  2. Sense of Market Momentum: Lagging indicators also give traders a sense of market momentum, helping to determine the strength of a trend. For example, if a stock’s price is consistently rising over a certain period of time, it can be assumed that the stock has a positive momentum and may continue to rise in the future.

  3. Accessible for Traders of All Levels of Experience: Another advantage of lagging indicators is that they offer a simple and straightforward approach to analyzing market data, making it accessible for traders of all levels of experience. Even traders who are new to technical analysis can use these indicators to make informed investment decisions.

    Cons of Using Lagging Indicators in Stock Trading

  1. Based on Past Data: One of the biggest limitations of lagging indicators is that they are based on past data, so they may not accurately predict future market trends. This means that traders must use these indicators in combination with other analysis techniques to get a complete picture of the market.

  2. False Signals in Choppy or Non-trending Markets: Another limitation of lagging indicators is that they can provide false signals in choppy or non-trending markets. In these types of markets, stock prices can fluctuate rapidly, making it difficult for lagging indicators to accurately predict future performance.

  3. Slower in Detecting Changes in Market Trends: Lagging indicators tend to be slower in detecting changes in market trends compared to leading indicators. This means that traders may miss out on potential opportunities if they rely solely on lagging indicators to make investment decisions.

Conclusion

Lagging indicators can be a useful tool for stock traders when used in combination with other analysis techniques. However, traders must be aware of the limitations of these indicators and use them wisely in order to make informed investment decisions.

Share Predictions mobile app provides variety of technical indicators in the form of lagging indicators, including Bollinger Bands, for both common stocks and ETFs from stock markets in USA. You can view and analyze trends on the chart and easily identify potential bullish and bearish signals based on these indicators when doing your technical analysis.

Bollinger Bands

Bollinger Bands

What is Bollinger Band?
&
How is it used in stock trading?

Bollinger Bands are a type of technical indicator used in stock trading to help identify potential buying and selling opportunities. They were developed by John Bollinger in the 1980s and are named after him.

The indicator consists of three lines: a simple moving average (SMA) in the middle, and an upper and lower band that are typically two standard deviations away from the SMA. The bands are used to indicate volatility in the stock’s price. When the bands are close together, it suggests that the stock’s price is relatively stable, and when the bands are far apart, it suggests that the stock’s price is more volatile.

One way to use Bollinger Bands in stock trading is to look for opportunities to buy when the stock’s price touches the lower band, and to look for opportunities to sell when the stock’s price touches the upper band. This is because when the stock’s price touches the lower band, it is considered oversold, and when the stock’s price touches the upper band, it is considered overbought.

Another way to use Bollinger Bands is to look for a breakout when the stock’s price moves outside of the bands. A breakout to the upside suggests that the stock’s price is likely to continue to rise, while a breakout to the downside suggests that the stock’s price is likely to continue to fall.

It’s worth noting that Bollinger Bands are not a standalone indicator and is best used in conjunction with other technical indicators and analysis to identify potential trading opportunities. Also, Bollinger Bands are not always accurate and can produce false signals, so it’s essential to use them in combination with other forms of analysis and to keep a strict risk management strategy in place.

Bollinger Bands have both advantages and disadvantages as a technical indicator in stock trading.

Pros:

  1. They help identify potential buying and selling opportunities by showing the volatility of a stock’s price.
  2. They can be used to identify overbought and oversold conditions in the market.
  3. They can be used to identify potential breakouts in the stock’s price.
  4. They are relatively simple to understand and use.
  5. They can be used in conjunction with other technical indicators for a more comprehensive analysis.

Cons:

  1. They can produce false signals, so it’s essential to use them in combination with other forms of analysis.
  2. They are based on past data and may not always accurately predict future price movements.
  3. They do not take into account fundamental factors that may affect a stock’s price, such as company performance or economic conditions.
  4. They can be affected by market volatility and may not be as useful in volatile market conditions.
  5. They do not indicate the strength or weakness of the trend.

It’s important to keep in mind that Bollinger Bands are just one tool among many that traders can use to analyze the market and make trading decisions. It’s essential to use Bollinger Bands in conjunction with other forms of analysis and to keep a strict risk management strategy in place. Additionally, it’s essential to be aware of the limitations of the indicator and not to rely solely on it to make trading decisions.

In conclusion, Bollinger Bands are a useful tool for stock traders to help identify potential buying and selling opportunities by showing the volatility of a stock’s price. However, as with all technical indicators, it should not be relied upon solely and should be used in conjunction with other forms of analysis and a strict risk management strategy.

Share Predictions mobile app provides variety of technical indicators, including Bollinger Bands, for both common stocks and ETFs from stock markets in USA. You can view and analyze trends on the chart and easily identify potential bullish and bearish signals based on these indicators when doing your technical analysis.

How to Use MACD and Moving Averages in Trading

How to Use MACD and Moving Averages in Trading

Importance of using multiple indicators to confirm a trading signal
&
How to use MACD and moving averages together in trading

One of the most popular techniques in technical analysis is using multiple indicators to confirm a trading signal. This is where combining the MACD and moving averages can be particularly useful.

A moving average is a trend-following indicator that shows the average price of a security over a certain period of time. By plotting a moving average on a chart, traders can identify the direction of the trend and also spot potential changes in the trend.

The MACD is a momentum indicator that is calculated by subtracting the 26-day exponential moving average (EMA) from the 12-day EMA. By plotting the MACD on the same chart as the moving average, traders can see how the stock’s momentum is changing in relation to the trend.

One way to use the MACD and moving averages together is to look for bullish and bearish crossovers. A bullish crossover occurs when the MACD line crosses above the signal line, and a bearish crossover occurs when the MACD line crosses below the signal line.

Another way to use the two indicators together is to use the moving average as a filter to confirm the MACD signals. For example, if a bullish crossover occurs and the stock’s price is above the moving average, it can be a stronger signal to buy. Conversely, if a bearish crossover occurs and the stock’s price is below the moving average, it can be a stronger signal to sell.

Another way to use the two indicators together is to use the moving average as a confirmation of the direction of the trend. For instance, if the stock price is above the moving average, and the MACD is showing a bullish signal, it confirms that the stock is trending upward. And the opposite is true when the stock price is below the moving average.

It’s also worth noting that different moving averages have different characteristics. For example, a short-term moving average like a 50-day EMA will react faster to price changes than a long-term moving average like a 200-day EMA. Traders can use different moving averages to suit their trading style, whether it is short-term or long-term.

In summary, by combining the MACD and moving averages, traders can gain a better understanding of the stock’s momentum and trend. By using the two indicators together, traders can filter out false signals and confirm valid signals to make more informed buy and sell decisions. As always, it’s essential to use proper risk management strategies, and to not rely solely on indicators to make trading decisions.

Share Predictions mobile app provides technical indicators, including MACD, Signal Line, and variety of moving averages, for both common stocks and ETFs from stock markets in USA. You can view and analyze trends on the chart and easily identify potential bullish and bearish signals based on these indicators when doing your technical analysis.

MACD

MACD (Moving Average Convergence Divergence)

What is MACD?
&
How to use it in stock trading


MACD is a popular technical indicator that is used to identify changes in the strength, direction, momentum, and duration of a trend in a stock’s price. It is calculated by subtracting the 26-day exponential moving average (EMA) from the 12-day EMA. A 9-day EMA of the MACD, called the “signal line,” is then plotted on top of the MACD to act as a trigger for buy and sell signals.

When the MACD line crosses above the signal line, it is a bullish signal, indicating that the stock’s upward momentum is increasing and that it may be a good time to buy. Conversely, when the MACD line crosses below the signal line, it is a bearish signal, indicating that the stock’s downward momentum is increasing and that it may be a good time to sell.

In addition to the crossover signals, the distance between the MACD line and the signal line can also be used to gauge the strength of the current trend. The greater the distance between the two lines, the stronger the trend.

Another way to use the MACD is to look for divergences between the MACD and the stock price. A bullish divergence occurs when the MACD is making new highs while the stock price is making new lows, indicating that the stock’s downward momentum is weakening and that the trend may be reversing. A bearish divergence occurs when the MACD is making new lows while the stock price is making new highs, indicating that the stock’s upward momentum is weakening and that the trend may be reversing.

It’s important to keep in mind that the MACD is a lagging indicator, meaning that it will only confirm a trend after it has already begun. As such, it should not be used as a sole indicator for making trading decisions. It’s always recommended to use multiple indicators and also to use it in conjunction with a proper risk management strategy.

In summary, the MACD is a powerful technical indicator that can be used to identify changes in the strength, direction, momentum, and duration of a trend in a stock’s price. By understanding how to interpret the crossover signals and divergences, traders can use the MACD to make more informed buy and sell decisions.

Share Predictions mobile app provides technical indicators, including MACD, for both common stocks and ETFs from stock markets in USA. You can view and analyze trends on the chart and easily identify potential bullish and bearish signals based on MACD and Signal Line.

How to Use Moving Averages in Trading

How to Use Moving Averages in Trading

What is moving average?
&
Pros and cons of using moving averages in stock trading

What is moving average

Price trend of a given stock is never smooth which makes it hard to get an opinion about the approximate future direction of the price trend. And moving averages are mainly used to cope with this challenge by helping smooth out the price data. It is a commonly used technical indicator in technical analysis. Traders/Investors can use either short term or long term moving averages depending on their trading/investing interests. With the help of moving averages, negative impacts of short-term fluctuations on the price of a stock are mitigated.

When calculating the moving average, the average is taken over a specific period of time, i.e. 5, 20, 50 or 200 days. And averages do not have to be taken on daily prices, it is also common to use weekly, monthly or minute based averages as well if such forms suit better for the type of trading strategy that is executed.
 
It is not possible to be 100% accurate in predicting stock prices but you may make some educated guesses and moving averages are one of the common tools that are used in technical analysis when estimating the potential future direction of a stock’s price. We will look into 2 ways of using moving averages in this study.
 
1) Golden Cross & Death Cross
When a relatively short-term moving average crosses above a long-term moving average, it is called Golden Cross and perceived as the confirmation of an uptrend. And when the opposite happens, it is called Death Cross and perceived as a bearish signal.
As an example, traders can buy a certain stock when the 20 days moving average crosses above its 50 days moving average, and can exit from their positions when the 50 days moving average crosses below its 20 days moving average.
Even though this method may work in some cases, it may also trigger quite a number of false positive signals because moving averages are calculated based on past prices and thereby are lagging indicators. Especially in short term trading, a trading method that solely relies on Golden Cross & Death Cross signals may not always be reliable and traders tend to combine these indicators with some other technical indicators as well when making their trading decisions.
The following chart shows this approach in practice. One example is definitely not enough to generalize findings but it is a good example that illustrates why this approach can give signals with a bit of delay which may be an issue especially in short term trading. You can observe the delays in both buy and sell signal points.
2) Stock Price & Moving Average
Another way of using moving averages is to compare the direction of stock price and moving average value with each other. If the price of a given stock crosses above its moving average, it is perceived as a bullish signal. And the opposite is considered as a bearish one. Relatively shorter term moving averages (i.e. 20 days) are used for short term trading, and longer term moving averages (i.e. 200 days) are more commonly used for longer term trading. This approach is also prone to generating false positive signals because it still depends on a lagging indicator and should be strengthened by combining with other types of indicators as well to more reliably confirm the trend reversal.
If we look at the same chart from the example above, we can observe that buy and sell signals are triggered with a comparably earlier timing compared to the first approach discussed above; and this happens to be an advantage in this particular example. However, this may not always bring an advantage because this second approach can, for example, trigger an unnecessary (or too early) sell signal while the uptrend is not yet over.

 Final Words

Both approaches discussed above have their own pros and cons. The second approach discussed above will likely be triggering buy & sell signals a bit quicker than the first one because it relies on the 20 days moving average while the first approach relies on both 20 and 50 days moving averages and since 50 days is a lot longer than 20 days it will lead to triggering signals with a bit of delay (compared to the other approach). When it comes to which approach can be more profitable when used in trading, the answer will likely be “It depends” because both approaches may perform differently based on market conditions (i.e. in a bear market or bull market) and also which periods (20, 50, 200 or another value) are selected when calculating moving averages.
At the end of the day, since moving averages are lagging indicators, they should anyhow not be used as the only indicator when developing trading strategies. But they can be used in combination with other types of technical indicators to confirm the occurrence of potential trend reversals. You can select the one that makes more sense to your trading strategy but it is a more common practice to look at different technical indicators when developing trading strategies rather than using only one single indicator.