Trend Trading

What is Trend Trading?

How to pick stocks for trend trading
&
Trend trading case study

What is trend trading

The overall price direction of a given stock defines its trend. An uptrend is identified when the overall price direction keeps making higher highs and also higher lows in the time line. Similarly, a downtrend is identified when the overall price direction keeps making lower highs and lower lows. Neither an uptrend nor a downtrend continues forever. Trend trading is a commonly used trading technique using which traders try to enter into a long position in the occurrence of an uptrend and a short position when a downtrend starts. Trend trading is used by both short term and long term traders.

Technical indicators are commonly used when identifying an uptrend and downtrend in the markets. Both short term and long term traders can use trend trading, and what primarily differs between them is the type of indicators that they follow when identifying short term and long term trends.

For any trend trader, developing a game plan involves defining when to buy and when to sell a given stock. Developing such a game plan and implementing it in a disciplined way help traders to execute their trading decisions in a non-emotional way.

Case example

It is possible to develop a game plan for trend trading in different ways. In this case study, we will focus on short term trading and be using 2 types of technical indicators. For the sake of this case study, we will be focusing on 500 stocks with highest market capitalization from US stock markets.

Trend trading game plan

To enter into a long position, our methodology will be following a stock during 3 days:
– Day 1: The closing price of the stock shall be below its 20 days moving average.
– Day 2: The closing price of the stock shall be above its 20 days moving average. This means that the closing price of the stock crosses above its 20 days moving average.
– Day 3:
– The closing price of the stock shall remain above its 20 days moving average. This will mean that the closing price of the stock remained above its 20 days moving average on 2 consecutive days after crossing it.
– Histogram is greater than zero. Histogram is calculated by subtracting Signal Line value from MACD. A positive Histogram value signifies a recent increase in upward momentum. By adding this additional control, we will aim to decrease the number of false positive buy signals.
– Day 4: The stock that meet all the listed criteria above will be purchased on this day. And the open price of the stock on this day will be taken as the reference buy price when evaluating the performance of this approach.

Defining when to enter into a long position is just one side of the problem. We also need to define our exit strategy, that will tell us when to enter into a short position.
– After the end of each market day, the Histogram value will be updated based on the latest trading day that ended. If the Histogram goes below zero, a sell signal will be triggered for the next trading day. When deciding when to exit from the long position, as you will recognize, we are not looking at the 20 days moving average as we did when entering into the long position. This is chosen so because Histogram tends to signal a trend reversal (from uptrend to downtrend) a bit earlier than moving average figures. For the sake of this case study, the sell price will be taken as the opening price of the stock on the next market day.

Summary of backtesting results

The study is backtested on 500 stocks with highest market capitalization for almost 6 years of data. Defined criteria above triggered 14000 buy-sell signals. For the case of this study, it is assumed that the initial budget was $100, and $10 is invested on each stock that triggered the buy signal (no matter the changing total budget size over the time). At the end of all buy-sell executions, the initial $100 budget reached $1789 at the end of 6 years, returning a 1689% profit in total.

This is a rather aggressive method because it aims to capture profits in short term and aims to catch a potential uptrend as early as possible. As a result, it can be expected to see some false positive (buy) signals. The following chart shows average profit/loss figures vs the average number of days a stock is held after the purchase.

As seen in the chart above, as the number of days increases after the purchase of the stock, the achieved profit increases as well. Up until 15 days, the strategy creates more losses than profits and the maximum average loss stays at the levels of -5%. Starting from 16 stock holding days after the purchase, profits start to dominate. But this chart does not show the actual number of trades that ended with profit and loss; so let us have a look at the next one to get an idea about it.

As seen in the above chart, 55% of the buy signals ended with a loss while 45% of the buy signals returned profit. Even though the number of losses is higher, the overall result is still a profit due to the fact that achieved profit figures are higher than that of losses.
Waiting for a longer time for the confirmation of an uptrend before going into a long position can be an option to decrease the number of losses but our tests show that such a more conservative approach causes the overall profit go down in the long run.

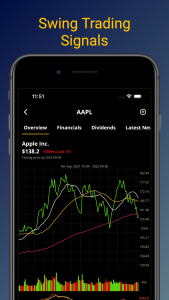
Share Predictions mobile app provides tools to develop your own trend trading strategies. It also runs an example portfolio that is created based on algorithmic buy, hold and sell signals. You can follow the results of trend trading portfolio study in our application. Share Predictions is available in both Apple App Store and Google Play Store.

Swing Trading

What is Swing Trading?

Importance of volatility and liquidity in swing trading
&
How to pick stocks for swing trading

What is swing trading?

Swing trading is a trading technique that aims to capture short- to medium-term gains in a stock over a period of a few days to several weeks, and relies heavily on technical analysis when developing trading strategies. Rather than companies’ fundamentals and intrinsic value, swing traders use trends and patterns when taking their trading decisions.

Swing trading enables better control and flexibility to be able to time markets and take advantage of either price direction (either an increase or decrease) but it also brings some risks because unexpected events or news may cause the price of a given stock change in the unexpected direction.

Importance of volatility and liquidity in swing trading

The first key to a successful swing trading is picking the right stocks which are often volatile and have a relatively high level of liquidity. Volatility is likely the most important ingredient to swing trading, which creates buy/sell opportunities with the help of price movements. More volatile stocks create more opportunities to make profit in swing trading. Higher liquidity makes it easier to sell stocks when you need it.

How to pick stocks for swing trading

Swing trading relies heavily on technical analysis. Simple Moving Averages (SMAs) are widely used to determine support and resistance levels, as well as bullish and bearish patterns.
But how would you scan thousands of stocks each day and detect the ones with biggest upside potential in the short term? This is the main reason why we have developed Share Predictions mobile app.
Share Predictions provide AI powered predictions for the short term price movement of common stocks. Each prediction indicates the likelihood of a price increase (or decrease) in the short term, and predictions are renewed on a daily basis as we collect more data from markets.
If a prediction is above 50%, it indicates a price increase expectation for the corresponding common stock in the short term (roughly 1 month); otherwise, a price decrease is expected. As a prediction gets closer to 100% (or 0%), it indicates a stronger algorithmic expectation for a price increase (or decrease) within the validity period of the prediction.

Short listed common stocks for swing trading

While Share Predictions provide a unique prediction for each of thousands of common stocks, it also offers a short listed stocks that include such stocks with biggest upside potential in the short term.
There is one short list for penny stocks, and another one for the rest of the common stocks. These stocks, particularly the penny stocks, happen to be a more volatile than others but it is likely not the only reason why they end up in the short listed ones. It may be so that a particular stock has had a significant price reduction lately and our models may be expecting a certain price correction, or there is maybe an ongoing positive trend and our models may be expecting the continuation of the trend in the short term.
For each prediction in the short listed stocks, we also share a reference buy target, sell target, and stop loss value so that traders can get a clearer understanding of the scope of each trading opportunity.
These predictions are indicative and aim to provide a short list of stocks that short term traders can focus on and perform a secondary technical analysis to be able to give the best possible trading decision. To enable this, Share Predictions provides premium analysis tools. You can analyze each stock from multiple angles by looking at charts where you can follow the trends of price, simple moving averages, Bollinger Band, MACD, Signal Line, and RSI. Moreover, you get access to additional technical indicators (i.e. volatility figures of stocks), company financials (taken directly from both quarterly and annual financial reports), dividend history, and even latest stock specific market news from well known financial media sources. AI predictions, combined with a secondary technical analysis, aim to give you the best possible opportunities in your trading decisions.

Quantitative Trading

What is Quantitative Trading?

How does it differ from Algo Trading?
&
What do you need to develop your own Quantitative Trading solutions?

What is Quantitative Trading?

Quantitative Trading (a.k.a. Quant Trading) is the process of identifying trading opportunities by using computer algorithms that are developed based on mathematical models and historical market data. These trading techniques are mostly used in short term trading, and commonly utilized by hedge funds and high frequency trading firms.

While some of these Quantitative Trading techniques are built based on simplistic mathematical models, some others involve very complex mathematical modelling by using large data sets to be able to identify trading opportunities.

Quantitative Trading vs. Algo Trading: What is the difference?

Algo Trading is a subset of Quantitative Trading that uses a software program that executes buy & sell orders based on strictly defined rules in the designed algorithm of the software program itself. Such algorithms are mostly used in high frequency trading and no human interaction is involved in the trading execution phase. The whole process of buying and selling securities is automated.

Apart from developing trading strategies by using advanced mathematical models, Quantitative Trading involves conducting research and analyzing historical data for finding trading opportunities to make profit. Once the trading strategy is built, trades can be executed manually, or automatically (e.g. by utilizing algo trading techniques).

Can I develop Quantitative Trading solutions on my own?

Yes, it is possible. But you need a lot of things in place before you can start.
First, you need to have access to market data in a format that you can use when developing your Quantitative Trading strategies. Since Quantitative Trading strategies are mostly developed by using huge amount of data, you need to have access to machines with enough computational power that can handle the amount of stock market data you will be using when developing your trading strategies.
Next, apart from the mathematical knowledge that you need to be able to build and test your statistical models, you also need programming experience to be able to create your own systems.
There is nothing that says that Quantitative Trading strategies cannot be simple but if you want to develop more sophisticated ones (e.g. by using the techniques of Artificial Intelligence), you need to learn how to develop and program such solutions too.

At the end of the day, Quantitative Trading is not a goal by itself, it is rather a sort of tool that you can use to develop trading strategies. If developing your own Quantitative Trading strategies is not an option, Share Predictions mobile app offer AI powered short term predictions for the price movement of all common stocks from US stock markets. These predictions are calculated by using advanced mathematical modelling and aims to provide an algorithmic prediction on whether the price of a given common stock is expected to go up or down in the coming month. Predictions are renewed at the beginning of each market day as we collect more data from markets, and are made available to users in the beginning of the market day.
Beside AI powered short term price movement predictions, Share Predictions also offers premium stock analysis tools. You can use the Stock Screener function to create your own portfolio, the Dividend Tracker function to follow upcoming dividend payments of stocks, and also analyze stock charts, technical indicators, company financials, dividend history and company specific news at one single place to be able to do a proper analysis for each common stock when determining which stocks to include in your trading portfolio. Share Predictions mobile app is available in both Apple App Store and Google Play Store.

Dividend Payout Ratio

Dividend Payout Ratio

What is Dividend Payout Ratio?
&
W
hy is it important?

A dividend is the distribution of a company’s earnings to its shareholders and is determined by the board of directors in the dividend payer company. With other words, companies share some of their earnings with their shareholders by paying dividends. Dividend Payout Ratio tells you which fraction of company’s earnings is paid in the form of dividends. By looking at the Dividend Payout Ratio, dividend investors can evaluate whether the dividend payer company’s dividend payment program is sustainable.

How to calculate Dividend Payout Ratio

It is calculated as the yearly dividend per share divided by the earnings per share (EPS). It is often expressed as percentage. When calculating yearly dividend per share and EPS, investors often look at the most recent 12 months, a.k.a Trailing Twelve Months (TTM).

Example:
If a given company has paid out $2 dividend per share in the last 12 months (Dividend per Share TTM) and its EPS TTM is $8, the Dividend Payout Ratio (TTM) for this company is (2 / 8) x 100 = 25%; meaning that this company has shared 25% of its earnings with its shareholders.

What if Dividend Payout Ratio is too low?

If the net income of the company is positive, meaning that the company is profitable, and the Dividend Payout Ratio is low, you should check what the company is doing with the rest of their earnings. If the money is used in a way that can potentially make the share price go up, it is a good sign.
Growth companies tend to have lower Dividend Payout Ratio and tend to use their earnings to make their companies grow. As companies get more mature, their Dividend Payout Ratio tend to increase as well over the time.

What if Dividend Payout Ratio is negative?

For Dividend Payout Ratio to have a negative value, EPS needs to be negative, which shows that the company is essentially paying out dividends by using the existing cash or raising additional money to be able to make the payment, which is not a good sign.
Some companies that consistently pay out dividends may choose to continue doing so even at times when they report negative earnings. In such cases, you should more closely study the financial situation of the company because the share price may go down in the near future or they can also cut dividend payments moving forward.

What if Dividend Payment Ratio is too high?

Although a high Dividend Payout Ratio sounds attractive for a dividend investor, it is not always a good sign. An unexpectedly high Dividend Payout Ratio can indicate that the company does not necessarily have intentions or plans for further growth, which is not a good sign for the share price.

Is there an optimal Dividend Payout Ratio that dividend investors should be looking for?

Dividend Payout Ratio indicates if the dividend payer company can sustain its dividend payment program. But what ratio is perceived to be good varies from one industry to another, and depends also on the future growth plans of each such company.
For instance, REITs (Real Estate Investment Trust) tend to have higher Dividend Payout Ratio (mostly above 90%) due to laws and regulations. A Dividend Payout Ratio of 20-50% is considered healthy for most value stocks (for more mature companies), while anything over 50% could be unsustainable in the long run indicating that the company may not sustain the level of dividend payment in the future.

Share Predictions mobile app provides a strong Dividend Tracker function that helps you track upcoming dividend payments from companies in US stock markets. For each dividend payer company, you can follow dividend amount, dividend frequency, dividend yield, dividend TTM and also Dividend Payout Ratio. You will also find the complete dividend history of each company. Share Predictions is available in both Apple App Store & Google Play Store.